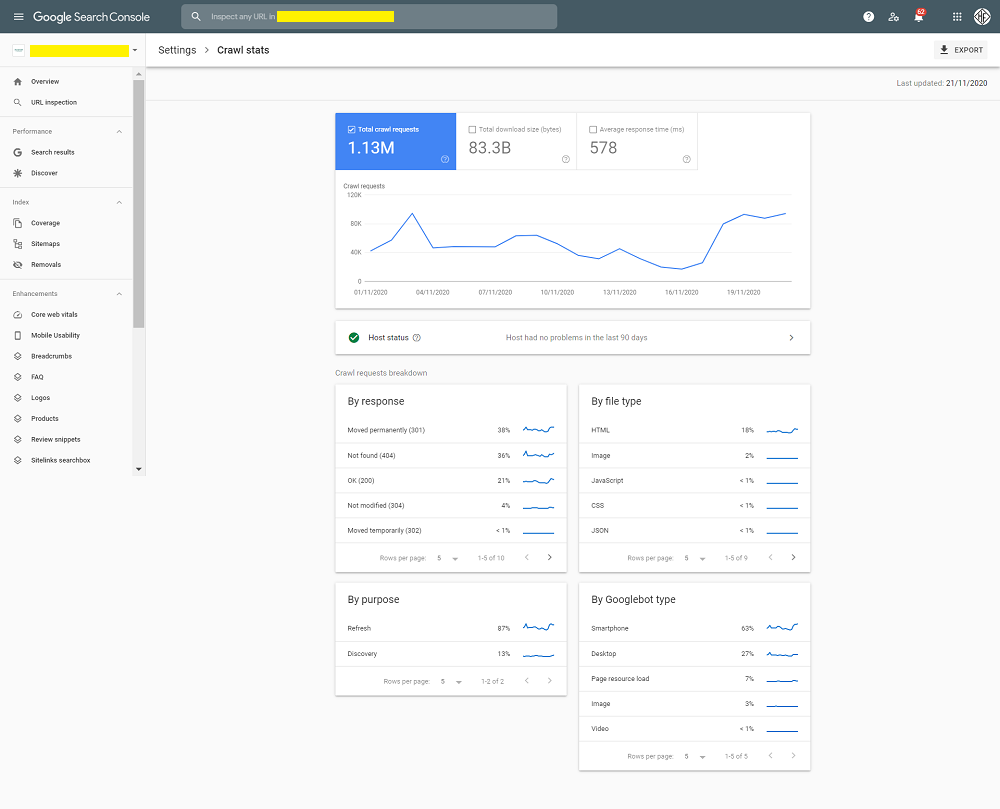
Today, Google announced the launch of a brand-new version of the Search console crawl stats report to help webmasters better understand Googlebot crawls of their websites. This is a nice improvement to those legacy crawl stat reports. Helps give a quick view of what pages Googlebot is crawling, what user-agent bot is it frequently crawling with, your host’s status, etc.
To view the new crawl stats report, visit this link or locate the report on the Settings page.

I personally think this gives SEO’s working for smaller sites (usually with limited IT resources), a chance to see some useful data within the search console itself, not having to worry about requesting IT for Googlebot server logs and having to process them using a log file analyser.

The additions to the report include valuable Googlebot crawl insights such as;
- Crawl requests breakdown by status codes (200, 301, 404, etc). My favorite report to monitor your crawl budget consumption on non-200 status code URLs.
- Crawl requests breakdown by file type (HTML, JS, CSS, image files, etc).
- Crawl requests breakdown by purpose (refresh/discovery). A steady increase in discovery is probably a good sign indicating Googlebot is finding and crawling new content on your site.
- Crawl requests breakdown by bot type (desktop bot, smartphone bot, etc). All sites by now should have a higher smartphone bot crawl percentage (Mobile-first index).
- Crawls on your host properties. Monitor Googlebot requests especially to your sub-domains to understand which ones are crawled more frequently than others. A nice report to also check host availability issues.
If server logs is something that you like dwelling into, I would recommend you to watch Jamie Alberico’s talk where she talks about using server logs to find very useful insights;
